Tokyo - The Impact of the Emissions Trading Scheme
Assessment of the territories’ climate action
2018
Association Climate Chance (Climate Chance)
Since 2015, the Climate Chance Association has been involved in the mobilization in the fight against climate change. It is the only international association that proposes to bring together on an equal footing all the non-State actors recognized by the UN. In order to strengthen their action and to give credibility to the climate stabilization scenarios, the Climate Chance Association launched in 2018 a Global Observatory of Non-State Climate Action, which aims to explain the evolution of greenhouse gas emissions, by crossing national public policies, with sectoral dynamics, private actors’ strategies, local public policies, and actions undertaken by the actors of the territory. In order to analyse the coherence of local public policies, Climat Chance proposes an assessment of « territorial mobilisations » through selected examples of cities and regions. Here, the city of Tokyo.
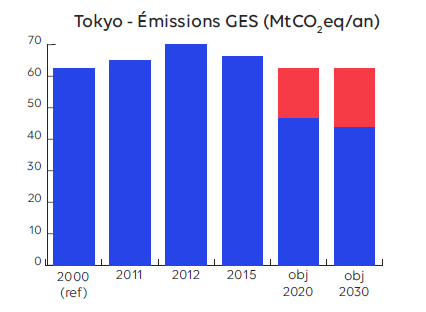
In 2012, emissions in the Tokyo metropolis rose sharply after the shutdown of nuclear power plants and the use of coal. Despite a decrease of 1.6% between 2014 and 2015, the 66.3 MtCO2eq emitted in 2015 represents a 6.6% increase since 2000, and seems to put out of reach the 25% reduction of GHGs by 2020 formulated in the Tokyo Climate Change Strategy by the Tokyo Metropolitan Government (TMG). Nevertheless, to confirm this long-term reduction, special attention is given to commercial buildings, which account for 43% of emissions, ahead of residential (27%), transportation (18%) and industry (7.9%).
RESULTS OF PHASE I OF THE TOKYO-CAP-AND-TRADE PROGRAM
The Tokyo-Cap-and-Trade Program implemented since 2010, covers approximately 1,300 commercial and industrial establishments whose energy consumption exceeds 1,500 hec-toliters toe/year. They account for 20% of Tokyo’s emissions and 40% of emissions from the commercial and industrial sector (IETA 2018). The results of Phase I (2010-2014) were particularly encouraging, showing a 12.7% decrease over this period, for a total and cumulative reduction of 12.27 MtCO2eq. The assessment report attests to a 26% reduction since the base year (2002-2007) from 16.50 MtCO2eq/y to 12.13 MtCO2eq/y in 2016 (GMT ETS 2018). Phase II targets a reduction of 15-17% between 2015 and 2019, but currently records only a 1% reduction between 2015 and 2016. The Tokyo strategy also includes a component involving the 660,000 small and medium-sized enterprises representing the 60% of industrial and commercial sector emissions not included in the allowance market : a dedicated Carbon Reduction Reporting (CRR) programme. The 23,786 facilities that reported their emissions in 2015 recorded a 13% decrease in emissions between 2010 and 2014 (CDP 2017). The impact of these programmes can be seen in the evolution of Tokyo’s final energy consumption, which is rapidly declining, by 2.4% between 2014 and 2015 and by 21.1% since 2000, mainly in the industrial and transportation sectors, which recorded a 40.8% and 41.7% drop respectively over the period 2000-2015. At the same time, renewables account for more than 11 per cent of final electricity consumption, thanks in particular to the 8.5-fold increase in solar energy production capacity between 2008-2015.
TRANSPORT LEADS THE WAY IN REDUCING EMISSIONS AND ENERGY CONSUMPTION
It is in transport that Tokyo is making the most progress, with a 36.1% drop of more than 6 MtCO2/year between 2000 and 2015. In this area, Tokyo seems to have followed its strategy in 2007 : mass transport, low-carbon vehicles and eco-driving. Its metro, connected to the world’s largest conurbation, will be the busiest in the world in 2018 with nearly 3.5 billion trips (UITP 2018). For the transport of goods, Tokyo has set up an energy efficiency indicator for 264 road transport companies and more than 10,000 vehicles. The publication and rating of their efforts is valuable information for their customers, encouraging them to promote eco-driving, which has already reduced their emissions by 20% and could reduce Tokyo’s transport emissions by 8% (CDP 2017). However, Tokyo is seeking to stimulate greater investment, by gradually imposing since 2003 CO2 and particulate emission standards, particularly for diesel vehicles, standards on the energy efficiency of vehicles on the road, as well as low-carbon vehicle quotas for companies according to the size of their fleets (Retrofit program).
Referencias
Para ir más allá
-
[a(https://www.kankyo.metro.tokyo.lg.jp/en/climate/index.files/GHG2015.pdf)
-
www.kankyo.metro.tokyo.lg.jp/en/climate/index.files/GHG2015.pdf]
-
www.kankyo.metro.tokyo.lg.jp/en/climate/cap_and_trade/index.html